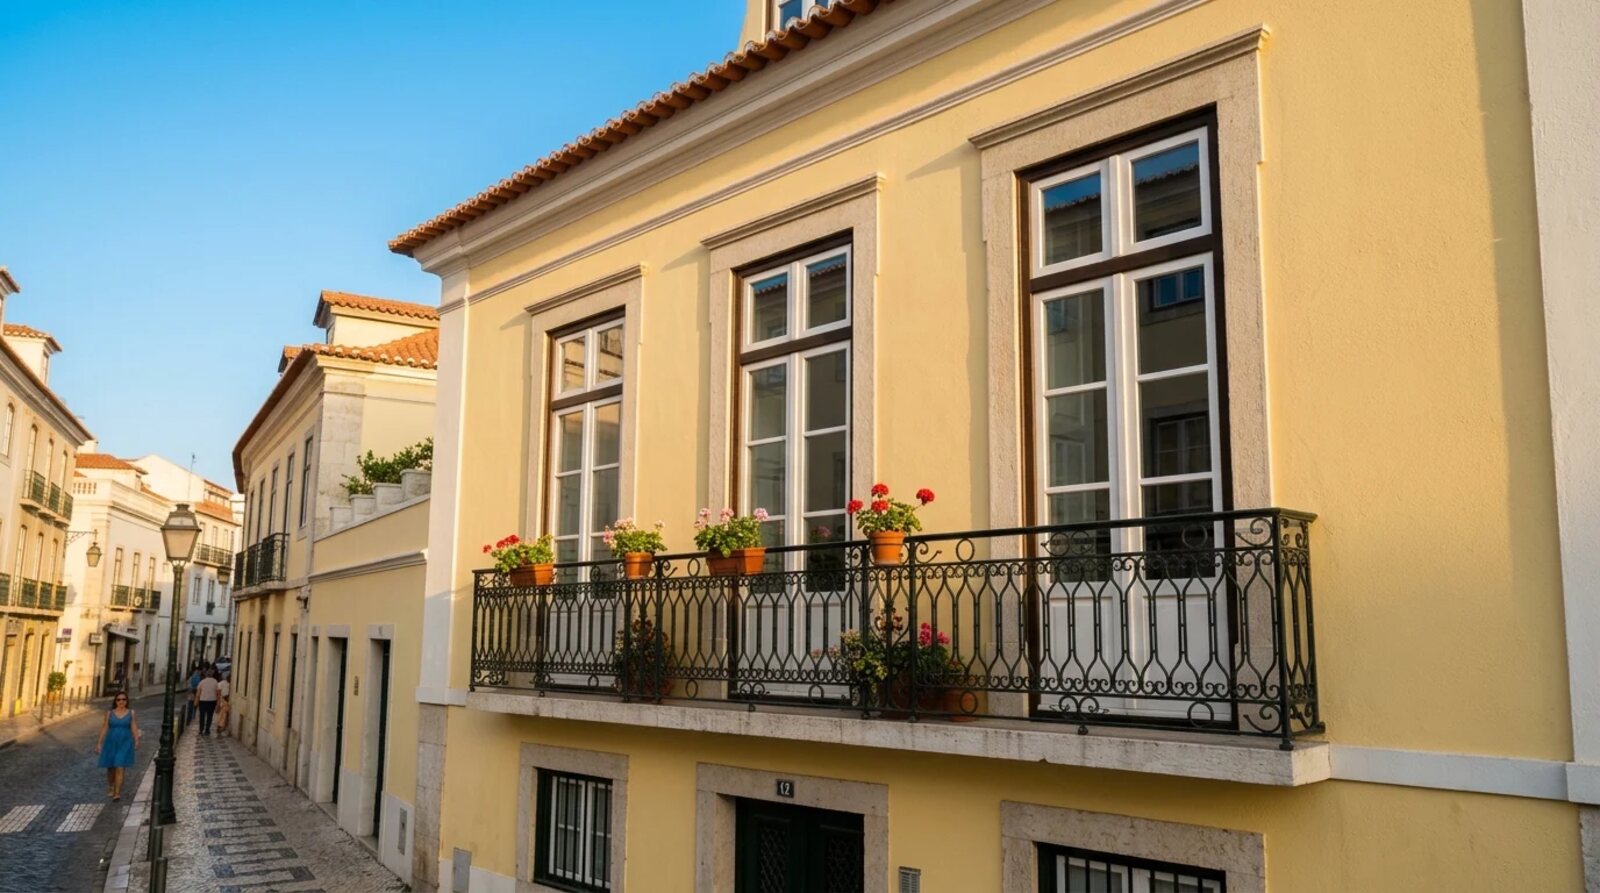
How many buildings in Lisboa are old? Statistics Portugal (INE) counted, in the 2021 Census, the buildings of every parish by period of construction. Lisboa has 49 223 buildings, and 60.3 % were built up to 1960. Up to 1980 it is 81.6 %. This page shows the numbers parish by parish and explains what you can (and cannot) take from them when thinking about replacing windows.
A warning from the start: the age of the building is not the age of the windows. Many windows in old blocks have already been replaced, and a 1970s building may have original or new windows. The numbers show where there are more old buildings, not what state the windows of each one are in.
What INE counts, and what it does not
- It counts buildings, not homes. A six-storey block counts as one building.
- It splits them by period of construction: before 1919, 1919-1945, 1946-1960, 1961-1980 and so on. We added the first three for “up to 1960” and the first four for “up to 1980”.
- The reference date is the 2021 Census (INE updated the data in 2024).
- It does not say what state the windows are in, or how many were replaced.
Table by parish
Sorted by the share of buildings built up to 1960, from highest to lowest.
| Parish | Buildings | Built up to 1960 | % up to 1960 | % up to 1980 |
|---|---|---|---|---|
| Misericórdia | 2 007 | 1 796 | 89.5 % | 94.1 % |
| Santa Maria Maior | 1 978 | 1 710 | 86.5 % | 90.4 % |
| São Vicente | 2 258 | 1 895 | 83.9 % | 94.0 % |
| Santo António | 1 471 | 1 139 | 77.4 % | 89.5 % |
| Arroios | 2 953 | 2 280 | 77.2 % | 91.5 % |
| Estrela | 2 781 | 2 135 | 76.8 % | 87.6 % |
| Ajuda | 2 716 | 2 007 | 73.9 % | 89.0 % |
| Penha de França | 2 425 | 1 770 | 73.0 % | 90.8 % |
| Alvalade | 2 489 | 1 776 | 71.4 % | 90.5 % |
| Alcântara | 1 493 | 1 052 | 70.5 % | 89.5 % |
| Campo de Ourique | 2 461 | 1 697 | 69.0 % | 89.2 % |
| Areeiro | 1 377 | 948 | 68.8 % | 84.7 % |
| Campolide | 2 255 | 1 424 | 63.1 % | 86.3 % |
| Beato | 1 730 | 1 083 | 62.6 % | 90.5 % |
| Belém | 2 885 | 1 643 | 56.9 % | 79.0 % |
| Avenidas Novas | 1 759 | 953 | 54.2 % | 79.4 % |
| Carnide | 1 383 | 635 | 45.9 % | 58.9 % |
| Benfica | 2 493 | 1 026 | 41.2 % | 80.2 % |
| São Domingos de Benfica | 1 726 | 638 | 37.0 % | 75.0 % |
| Olivais | 2 741 | 923 | 33.7 % | 80.0 % |
| Santa Clara | 1 675 | 461 | 27.5 % | 57.3 % |
| Marvila | 1 490 | 399 | 26.8 % | 63.0 % |
| Lumiar | 1 900 | 209 | 11.0 % | 40.5 % |
| Parque das Nações | 777 | 74 | 9.5 % | 25.7 % |
| Lisboa (whole municipality) | 49 223 | 29 673 | 60.3 % | 81.6 % |
What the numbers show
- Misericórdia has 89.5 % of its buildings built up to 1960, the highest share in Lisbon, followed by Santa Maria Maior (86.5 %) and São Vicente (83.9 %).
- At the other end, Parque das Nações (9.5 %) and Lumiar (11.0 %) are among the parishes with the newest buildings.
- In Lisbon as a whole, more than half of the buildings (60.3 %) date from before 1960 and more than four in five (81.6 %) from before 1980.
- Even the “newer” parishes on the list have old buildings: the average hides differences between streets.
If you are replacing windows in an old building
These pages answer the questions that come up most:
- Licence and condominium. Replacing frames with more efficient ones, with the same geometry and exterior finish, is exempt from a licence, but there are exceptions (listed buildings) and condominium rules. See Can I replace my windows?.
- Grants. There is no national grant open to everyone today; see what exists, including local programmes, in window grants.
- What it costs and how to compare offers. PVC window prices, with sources and the quote checker.
- Shutter box, ventilation and condensation. In old homes they count as much as the glass: roller shutter box, ventilation when replacing windows and window condensation.
- Measuring well. Before asking for offers, see how to measure windows.
- The city. PVC windows in Lisboa, with the climate zone and local notes.
What we could not confirm
- The number of homes (dwellings) by period of construction in each parish: we only used buildings, and that is what the table says.
- The state of the windows, or how many were already replaced in each parish: we found no public data.
- Specific rules of the Lisboa council for frames in historic or protected areas: we did not confirm any local rule; ask the council before ordering.
- Whether the energy class of the buildings in each parish follows their age: that is not what this table measures.
Sources
- INE, Censos 2021: Buildings by period of construction and need of repair (indicator 0012578): counts per parish, updated by INE on 19 March 2024. “Up to 1960” is the sum of the periods before 1919, 1919-1945 and 1946-1960; the percentages are our own calculation from INE data.
- INE, terms of use: INE statistics can be reused if the source is named (CC BY 4.0).
Source: Instituto Nacional de Estatística, IP – Portugal, Censos 2021, Edifícios por época de construção (indicator 0012578).
What to do next
- See whether your case fits the Can I replace my windows? check.
- Take the window grants quiz.
- Ask for offers with the right questions to the installer.